India's CO₂ Emissions by Sector:
Which Industries Will Feel CCTS Impact Most?
02 April, 2026
WOCE Team
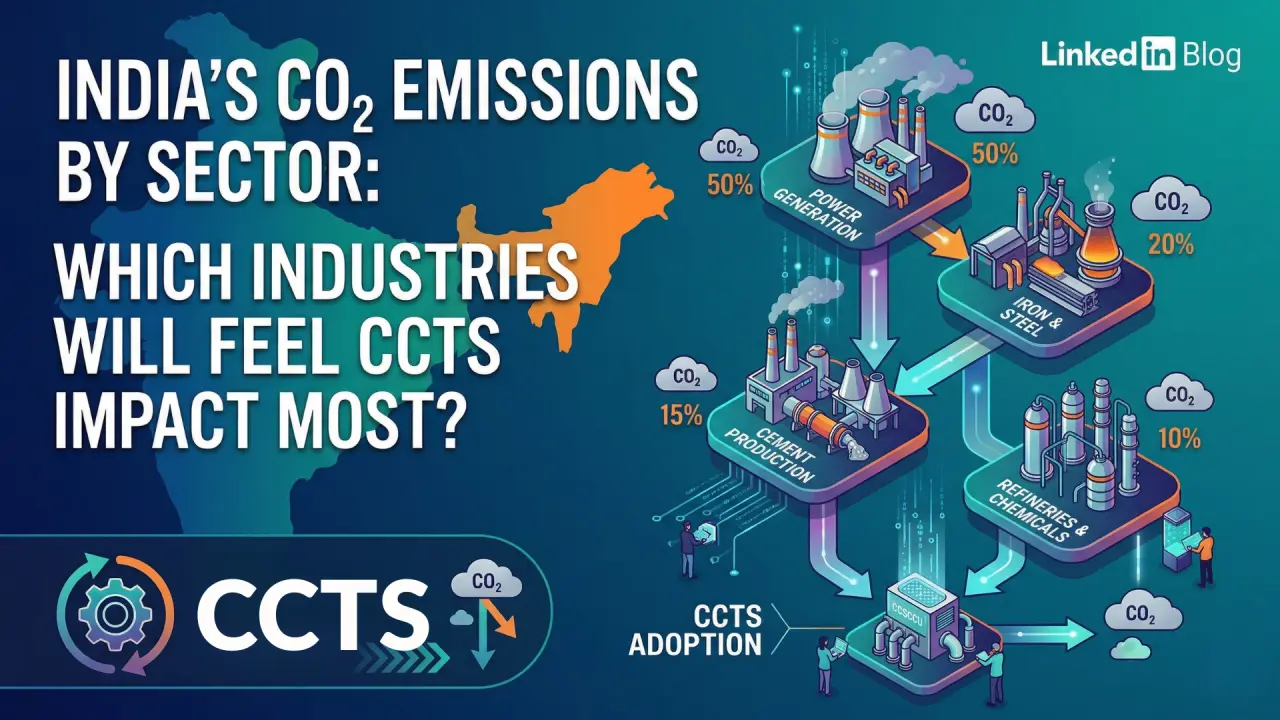
As India's carbon market covers 490 entities across nine sectors, understanding who bears the heaviest compliance burden reveals the strategic winners and losers
India's carbon dioxide emissions tell a story of rapid industrialization, infrastructure buildout, and an economy transitioning toward cleaner energy. In 2025, the country's CO2 emissions grew by just 0.7%, the slowest rate in more than two decades, driven largely by a dramatic 3.8% fall in power sector emissions as renewable energy surged.
But this emissions slowdown masks a critical divide. While power generation is decarbonizing rapidly, industrial sectors like steel and cement are accelerating emissions growth. Steel production surged by 8% and cement output jumped 10% in 2025, driving infrastructure expansion that tripled from 2019 to 2024.
This sectoral divergence matters enormously as India's Carbon Credit Trading Scheme begins compliance trading in 2026. The nine sectors now covered under CCTS face mandatory carbon pricing, but they represent very different emission profiles, growth trajectories, and carbon intensity challenges. Understanding which sectors will feel CCTS impact most reveals the strategic landscape for Indian industry over the coming decade.
India's Emissions Landscape: The Big Picture
More than half of India's CO2 output comes from coal used for electricity and heat generation, making the power sector the most important by far for the country's emissions. The second-largest sector is fossil fuel use in industry, which accounts for another quarter of the total, while oil use for transport makes up a further eighth of India's emissions.
In 2024, India was responsible for 8% of global energy-sector CO2 emissions. While this is below its 18% share of global population, emissions have been growing rapidly, contributing 37% of global energy-sector emissions growth over the past five years.
Recent emission trends reveal striking sectoral divergence:
Power sector emissions fell by 1% in the first half of 2025, after growing 10% per year during 2021-23. The driver? India added 38 gigawatts of solar, 6.3 GW of wind, 4.0 GW of hydropower, and 0.6 GW of nuclear in 2025, generating a record 90 terawatt-hours of clean electricity annually.
Steel and cement were the only major sectors to see increased emissions growth in the first half of 2025. While they were only responsible for around 12% of India's total CO2 emissions from fossil fuels and cement in 2024, they have been growing quickly, averaging 6% a year for the past five years.
Transport emissions showed zero growth in the first half of 2025, after rising 6% annually in 2021-23, as EV adoption began impacting passenger vehicles, though trucks remain the largest diesel consumers.
The Nine CCTS Sectors: Coverage and Impact
CCTS currently covers nine energy-intensive sectors with 490 obligated entities: aluminum, cement, chlor-alkali, pulp and paper, iron and steel, fertilizer, petroleum refining, petrochemicals, and textiles.
These sectors account for over 700 million tonnes of CO2 equivalent emissions annually, making India's carbon market one of the world's largest by coverage. But impact varies dramatically across sectors based on carbon intensity, growth trajectories, export exposure, and decarbonization options.
Steel and Iron: Maximum Impact, Maximum Pressure
Steel faces perhaps the most significant CCTS impact of any covered sector, driven by high emissions, rapid growth, and export market pressures.
Why steel feels the greatest impact:
The government is targeting domestic steel manufacturing capacity of 300 million tonnes per year by 2030, from 200 million tonnes currently. This 50% capacity expansion means steel production and associated emissions will surge even as carbon pricing takes effect.
Cement output rose 10% and steel output 7% in the first half of 2025, far in excess of the growth in economic output overall. The driver is infrastructure spending that tripled from 2019 to 2024, with government capital expenditure increasing 52% year-on-year in Q2 2025.
Steel production in India is predominantly coal-based through blast furnace-basic oxygen furnace routes, resulting in carbon intensity of 2.0-2.5 tonnes CO2 per tonne of steel. With intensity targets set at 2-3% reductions for 2025-26 and more ambitious cuts for 2026-27, facilities must either invest in efficiency improvements or purchase carbon credits.
The CBAM factor amplifies pressure:
Indian steel exports to Europe face the EU's Carbon Border Adjustment Mechanism starting 2026. Domestic carbon prices under CCTS may offset some CBAM costs if EU recognition is achieved, but steel manufacturers face dual carbon pricing regardless. This creates enormous incentive to reduce actual emissions rather than just purchasing credits.
Cement: Growth Trajectory Meets Carbon Intensity
Cement faces similar dynamics to steel with slightly lower carbon intensity but equally strong growth pressures.
Steel production surged by 8% and cement by 10% in 2025. The two sectors were responsible for 21% of India's total CO2 emissions from fossil fuels and industrial processes in 2025.
Cement production emissions come from both fuel combustion and the chemical process of converting limestone to clinker (process emissions). CCTS covers both sources, making cement's compliance obligations comprehensive.
The government projects 25% cement production growth by 2028 driven by infrastructure and housing demand. Meeting CCTS intensity targets while expanding capacity requires substantial investment in alternative fuels, waste heat recovery, clinker substitution, and carbon capture technologies.
Unlike steel, cement has fewer direct export pressures from CBAM since most production serves domestic demand. But the sector's sheer scale and growth trajectory make CCTS compliance financially material for all major cement producers.
Aluminum: High Intensity, Cleaner Options
Aluminum smelting is extraordinarily energy-intensive, with emissions determined largely by electricity source and electrolysis efficiency.
Primary aluminum production can range from under 4 tonnes CO2 per tonne (with hydropower) to over 16 tonnes CO2 per tonne (with coal power). India's aluminum industry uses mixed electricity sources, creating significant variation in carbon intensity across facilities.
CCTS intensity targets recognize this variation but still require year-on-year improvements. For aluminum smelters on coal-heavy grids, meeting targets demands either massive renewable energy procurement or carbon credit purchases.
The sector's advantage? Clear decarbonization pathways through renewable electricity. Several major aluminum producers are already investing in captive solar and wind capacity to reduce Scope 2 emissions, positioning them favorably for CCTS compliance.
Fertilizers: Chemical Complexity and Input Costs
Fertilizer production involves complex chemical processes with both direct combustion emissions and process emissions from ammonia synthesis.
Natural gas is the primary feedstock for ammonia-based fertilizers, making emissions intensity dependent on gas prices, process efficiency, and energy management. CCTS targets reflect sector-specific benchmarks but require continuous improvement.
The strategic challenge? Fertilizer is heavily subsidized with controlled pricing. Carbon compliance costs may be difficult to pass through to end users, compressing margins unless efficiency improvements offset credit purchase requirements.
Petroleum Refining and Petrochemicals: Recently Added, High Stakes
The January 2026 addition of petroleum refining and petrochemicals to CCTS brought 208 new obligated entities into the compliance framework. These sectors are critical given India's growing demand for fuels and chemicals.
Refining emissions come from processing crude oil through energy-intensive distillation, cracking, and reforming processes. Petrochemical production adds further emissions from chemical transformations.
Both sectors face complex allocation challenges when facilities produce multiple products. Determining emission intensity per product unit requires sophisticated carbon accounting and allocation methodologies still being finalized.
Textiles: Lower Intensity, Larger Employment Impact
Textiles represent the lowest carbon intensity among CCTS sectors but potentially the largest employment and MSME impact.
Textile processing involves dyeing, finishing, and heat-intensive operations but generally has lower emissions per rupee of output than heavy industries. CCTS targets reflect this with more modest reduction requirements.
The challenge? Textile production is fragmented across thousands of small and medium enterprises lacking sophisticated energy management and carbon accounting capabilities. Compliance support and capacity building will be critical to avoid unintended SME shutdowns.
The Sectors Not Yet Covered: Power and Transport
The most striking aspect of CCTS coverage is what's missing: the power sector and transport, together representing well over 60% of India's energy-related CO2 emissions.
Why power isn't included:
The power sector is already subject to comprehensive regulation through renewable energy obligations, energy efficiency standards, and the Perform, Achieve and Trade (PAT) scheme. Adding CCTS obligations could create regulatory overlap.
Moreover, power sector emissions fell by 3.8% in 2025, demonstrating that existing policies plus renewable energy economics are driving decarbonization without explicit carbon pricing.
However, future CCTS expansion to power seems inevitable as the market matures and coal power capacity continues operating to ensure grid reliability.
Transport's complexity:
Transport emissions are diffused across millions of vehicle owners, making intensity-based carbon pricing operationally challenging. EV adoption, fuel efficiency standards, and biofuel blending mandates are the primary policy tools.
Which Sectors Face Greatest CCTS Impact?
Synthesizing sectoral characteristics, three factors determine CCTS impact severity:
- Carbon intensity relative to targets: Steel and cement have high absolute emissions and modest initial targets, creating significant compliance obligations.
- Growth trajectory: Rapidly expanding sectors like steel and cement face growing absolute emissions even while improving intensity, requiring more credit purchases or efficiency investments.
- Decarbonization pathway clarity: Aluminum has clear pathways through renewable electricity. Steel and cement face technological and capital barriers to deep decarbonization.
- Export market pressures: Steel's CBAM exposure creates dual carbon pricing that cement largely avoids.
- Industry structure: Concentrated industries like aluminum can coordinate compliance investments. Fragmented sectors like textiles face coordination challenges.
Based on these factors, the sectoral impact ranking:
- Highest impact: Iron and steel (high intensity, rapid growth, CBAM pressure, technological barriers)
- Very high impact: Cement (high intensity, rapid growth, scale effects)
- High impact: Aluminum (very high intensity but clearer decarbonization paths)
- Moderate-high impact: Petroleum refining and petrochemicals (complex allocation, recent addition)
- Moderate impact: Fertilizers (moderate intensity, subsidy constraints)
- Lower impact (but high SME disruption risk): Textiles, pulp and paper, chlor-alkali (lower intensity, but capacity and structure challenges)
The Strategic Implications
CCTS is reshaping competitive dynamics within Indian industry. Companies investing early in measurement systems, efficiency improvements, and renewable energy gain advantages. Those treating compliance as minimal obligation face mounting costs as targets tighten.
The sectoral divergence also reveals policy priorities. The government is explicitly prioritizing infrastructure-driven growth in steel and cement even as carbon pricing takes effect. This creates tension between climate and industrial policy that future CCTS design must navigate.
For businesses in covered sectors, CCTS compliance is no longer optional or distant. With 490 entities obligated and trading commencing in 2026, carbon pricing is operational reality. The question isn't whether sectors are affected but how strategically companies respond to the compliance requirements reshaping their industries.
Sources: Analysis based on data from Carbon Brief/CREA (September 2025), IEA Global Energy Review 2025, Business Standard (March 2026), and Our World in Data.
WOCE provides comprehensive carbon market solutions including emissions measurement, intensity calculations, carbon credit strategy, and compliance automation. Contact us at contact@worldofcirculareconomy.com to navigate India's carbon market with confidence.